

A Laravel page that took 200 milliseconds in development takes three seconds in production, and nobody changed the code. That is the usual story behind a Laravel slow queries fix: the data grew, an index was never added, or one innocent-looking loop started firing hundreds of queries per request.
The good news is that slow MySQL queries are among the most fixable performance problems. You don't need a rewrite or a bigger server. You need to find the queries that actually hurt, read what MySQL says about them, and apply one of a handful of well-known fixes.
This guide is the process I follow in my database optimization and backend performance work when I'm asked to find and fix slow queries in a Laravel app: measure first, read the query plan, fix the cause, and prove the result. It is written for developers doing the work and for founders who want to know what a performance fix really involves.
Start by measuring, not guessing#
The most common mistake is adding indexes or cache layers before knowing which queries are slow. Two kinds of problem hide behind "the page is slow":
- One slow query. A single statement scans a big table and takes seconds.
- Many fast queries. Each takes 2 milliseconds, but there are 400 of them on one page. This is the classic N+1 problem, and no index will fix it.
Laravel lets you catch both. For a quick look at one request, log every query with its time:
use Illuminate\Support\Facades\DB;

DB::listen(function ($query) {
    logger()->info($query->sql, [
        'bindings' => $query->bindings,
        'ms' => $query->time,
    ]);
});
For production, you want an alarm instead of a firehose. whenQueryingForLongerThan runs a callback when the total time spent in queries during a request passes a limit:
use Illuminate\Database\Connection;
use Illuminate\Support\Facades\DB;

DB::whenQueryingForLongerThan(500, function (Connection $connection) {
    logger()->warning('Slow request: over 500ms spent in queries', [
        'url' => request()->fullUrl(),
    ]);
});
Put either snippet in a service provider's boot method. The second one tells you which pages to look at first.
Turn on the MySQL slow query log#
Laravel shows you what the application sent. MySQL's own slow query log shows what the database really spent time on, including queries from queue workers and scheduled jobs that your request-level tools never see.
SET GLOBAL slow_query_log = 'ON';
SET GLOBAL long_query_time = 0.5;
SET GLOBAL log_queries_not_using_indexes = 'ON';
Those settings last until the server restarts, so add them to the MySQL configuration file once you are happy with them. On a busy server, leave log_queries_not_using_indexes off at first because it can be noisy, and set long_query_time to something like one second.
After a day of normal traffic, group the log by query shape. MySQL ships with mysqldumpslow, and Percona's pt-query-digest does the same job in more detail. You are looking for the queries with the highest total time, which is the number of runs multiplied by the average duration. A 100 ms query that runs 50,000 times a day matters more than a 4-second report that runs twice.
If you already have error tracking and metrics in place, the same signals belong there too. I covered that setup in the Laravel observability guide.
Read the query plan with EXPLAIN#
Once you have a suspect, ask MySQL how it runs the query. Prefix it with EXPLAIN, or call explain() on a query builder in a recent Laravel version:
DB::table('orders')
    ->where('customer_id', 4821)
    ->where('status', 'paid')
    ->orderByDesc('created_at')
    ->limit(50)
    ->explain()
    ->dump();
Reading the EXPLAIN output takes practice, but four columns do most of the work:
| Column | What to look for |
|---|---|
type | ALL means a full table scan. ref, range and const mean an index is used. |
key | The index MySQL chose. NULL means none. |
rows | MySQL's estimate of rows it must examine. Compare it with the rows you actually return. |
Extra | Using filesort and Using temporary mean extra work to sort or group the result. |
If a query returns 50 rows but rows says 2,400,000, MySQL is reading the whole table to find them. That is the gap you close with an index. On MySQL 8.0.18 and later, EXPLAIN ANALYZE goes further and runs the query to show real timings next to the estimates.
Fix the five causes I see most often#
1. A missing or wrong index#
For the query above, the right index covers the equality filters first and the sort column last:
Schema::table('orders', function (Blueprint $table) {
    $table->index(['customer_id', 'status', 'created_at']);
});
Column order matters. Put columns you compare with = first, then the column you sort or range-filter on. An index on status alone is usually useless, because a column with a few distinct values barely narrows the search.
Don't add an index for every query. Each index slows down writes and uses disk. Add the ones your slowest, most frequent queries need, then re-run EXPLAIN to confirm MySQL uses them.
2. The N+1 problem#
This loop looks harmless:
$orders = Order::latest()->limit(50)->get();

foreach ($orders as $order) {
    echo $order->customer->name; // one extra query per order
}
That is 51 queries for a 50-row page. Load the relationship up front, as the Laravel eager loading docs describe:
$orders = Order::with('customer:id,name')->latest()->limit(50)->get();To stop N+1 from coming back, make Laravel complain about it in development. In a service provider:
use Illuminate\Database\Eloquent\Model;

Model::preventLazyLoading(! app()->isProduction());
Now a lazy-loaded relationship throws an exception while you are building the feature, instead of costing you a slow page in production. Many teams find this one line pays for itself within a week.
3. Selecting far more than you need#
SELECT * on a wide table drags large text and JSON columns across the wire for every row, even when the page shows two fields. Select only the columns you use, and use withCount() or withSum() instead of loading a whole relationship to count it.
For jobs that walk a big table, use chunkById() instead of get(). It keeps memory flat and avoids the skipped or repeated rows that plain chunk() can produce when you update the rows you're reading.
4. Queries that can't use an index#
Some queries ignore a perfectly good index:
- Wrapping the column in a function:
WHERE DATE(created_at) = '2026-10-01'. Use a range instead:created_at >= '2026-10-01' AND created_at < '2026-10-02'. - A leading wildcard:
WHERE name LIKE '%smith'. An index can't help here. Real search needs a different tool, which I wrote about in the full-text search architecture article. - Comparing a number column to a string, which can force MySQL to convert every row.
5. Deep pagination and expensive counts#
paginate() runs a COUNT(*) query on every page, and OFFSET 200000 makes MySQL read and throw away 200,000 rows before returning yours. For large tables, switch to simplePaginate() when you don't need page numbers, or cursorPaginate() for infinite scroll and APIs. Both avoid the deep offset.
Prove it worked#
Never trust a fix you haven't measured. For every change:
- Record the query time and the
EXPLAINoutput before. - Apply one change.
- Re-run
EXPLAINand time the query with production-sized data. A fast query on a 500-row dev database proves nothing. - Watch the slow query log for a day to confirm the real traffic improved.
Run index migrations carefully on a big table. Adding an index to millions of rows can lock or slow the table while it builds, so schedule it for a quiet period, and test the migration on a copy of production data first.
What I look at when the database is the bottleneck#
On client work, performance problems rarely come from one place. When I audited the freight forwarding platform, reviewing the database structure was part of understanding the system before any new development. That is the same habit this guide describes: read how the data is organised before you tune individual queries.
On data-heavy products like Violerts, which pulls property data from several city agencies into one platform, the shape of the queries matters as much as the infrastructure around them. If your app is slow and you aren't sure where the time goes, that service starts with exactly this measurement step.
When not to add a cache#
Caching is the tempting shortcut: wrap the slow query in Cache::remember() and move on. It works, but it hides the problem, and you inherit a new one, which is knowing when the cached data is stale. Fix the query first. Add caching only for queries that are already well-indexed and still too heavy to run on every request. The Redis caching architecture guide covers how to do that without serving wrong data.
Frequently asked questions#
How do I find slow queries in Laravel?#
Log query times with DB::listen, set an alarm with DB::whenQueryingForLongerThan, and turn on MySQL's slow query log. Start with the queries that have the highest total time, not just the slowest single run.
Will adding an index always make a query faster?#
No. An index only helps if MySQL chooses it, and it adds cost to every write. Check with EXPLAIN before and after, and remove indexes that nothing uses.
Is Telescope good enough for finding slow queries?#
Laravel Telescope is useful in development and staging because it lists the queries for each request and flags slow ones. In production it adds overhead, so most teams rely on the slow query log and an observability tool there.
When is the problem not the queries?#
If query time is small and the page is still slow, look at external API calls, large responses, missing queue offloading or a saturated server. Measure before blaming the database.
Key takeaways#
- Measure first: find the queries with the highest total time, not the ones you suspect.
- Use
EXPLAINto see whether MySQL scans the whole table or uses an index. - Most Laravel slowdowns come from five causes: missing indexes, N+1 loading, selecting too much, queries that can't use an index, and deep pagination.
- Turn on
preventLazyLoadingin development to catch N+1 early. - Prove every fix with before and after numbers on production-sized data.
If your Laravel app is getting slower as it grows and you want a senior engineer to find the cause, book a free call and we can look at it together.
Share this technical insight with your network
Share to LinkedIn or Facebook with key takeaways, featured media, and direct links.
Case Study: PPCWA: Jamaica Freight Forwarding Audit
I was brought in to audit and stabilize a nearly completed freight-forwarding platform built with custom Core PHP and MySQL. The platform manages the journey from international online purchases and overseas warehouse receiving through pre-alerts, package tracking, customs handling, and local delivery. My work focused on understanding the existing system before further development: auditing operational workflows, reviewing the database structure, assessing frontend maintainability, mapping dependencies, and evaluating configuration and environment governance. I also assessed the architectural path toward a future Laravel migration.
Related Technical Articles
View all articles →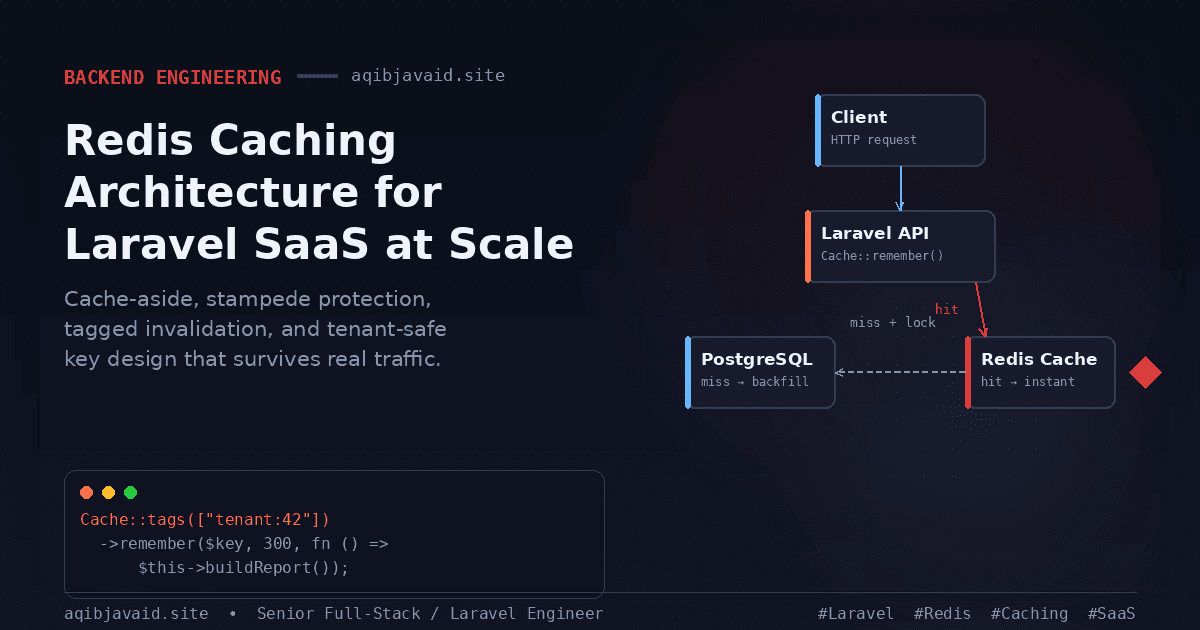
Redis Caching Architecture for Laravel SaaS at Scale
A cache with no invalidation story isn't a performance win. It's stale data waiting to embarrass you in front of a customer.
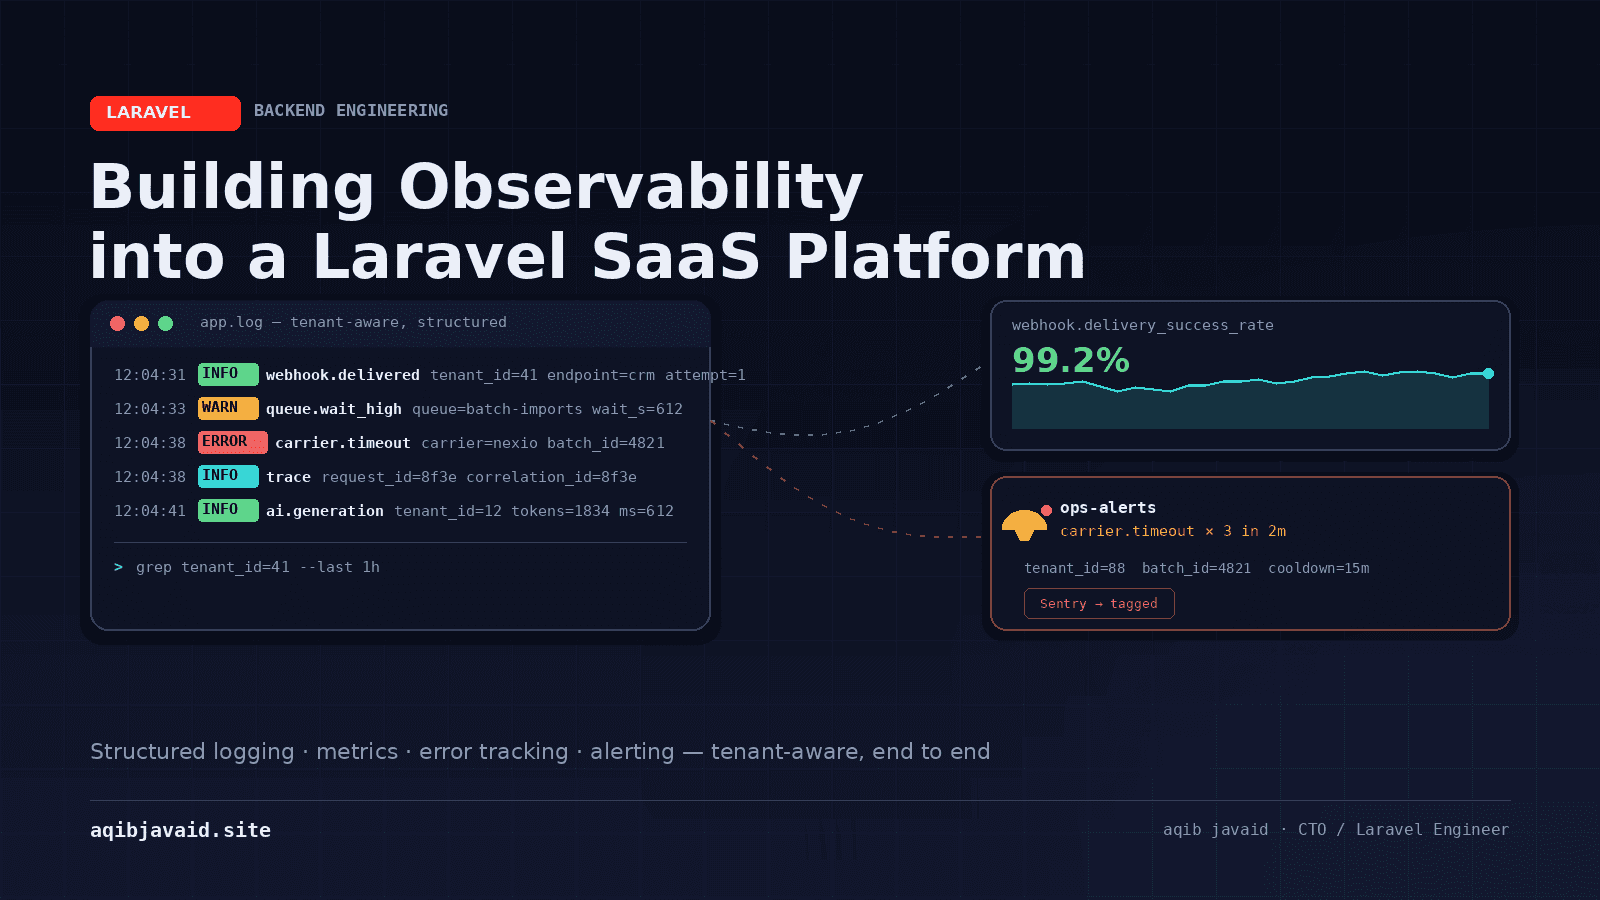
Building Observability into a Laravel SaaS Platform
A stack trace tells you what broke. It doesn't tell you which tenant, which request, or whether it's still happening right now.
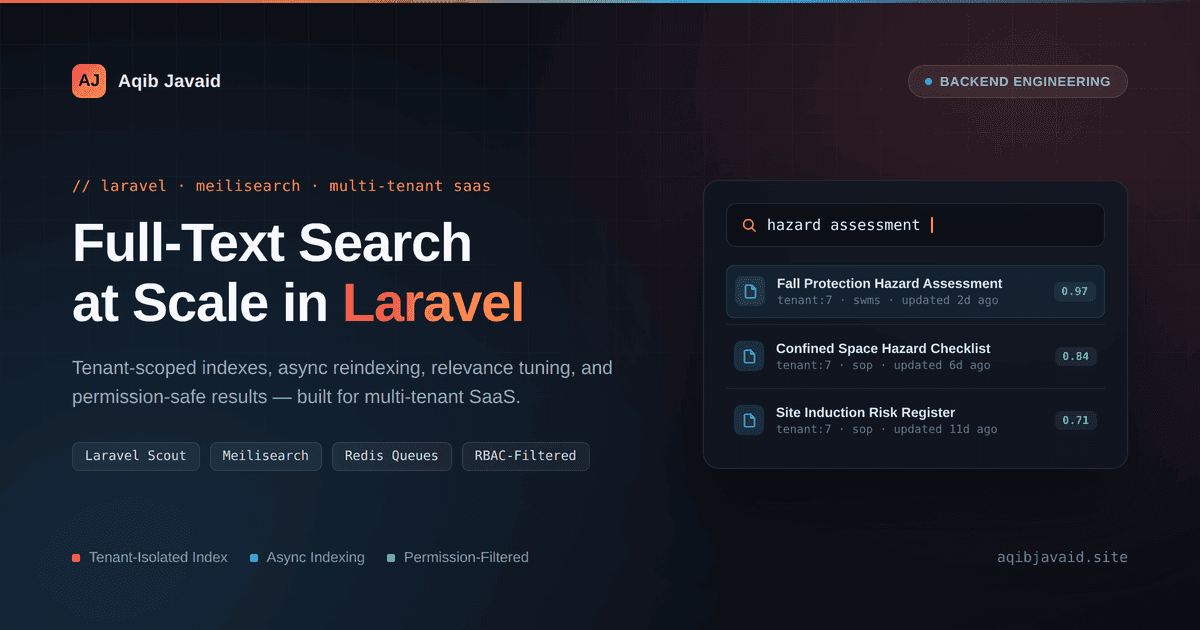
Building Full-Text Search in Multi-Tenant Laravel SaaS
WHERE title LIKE '%term%' works until customers expect search that's fast, relevant, and never leaks another tenant's records.
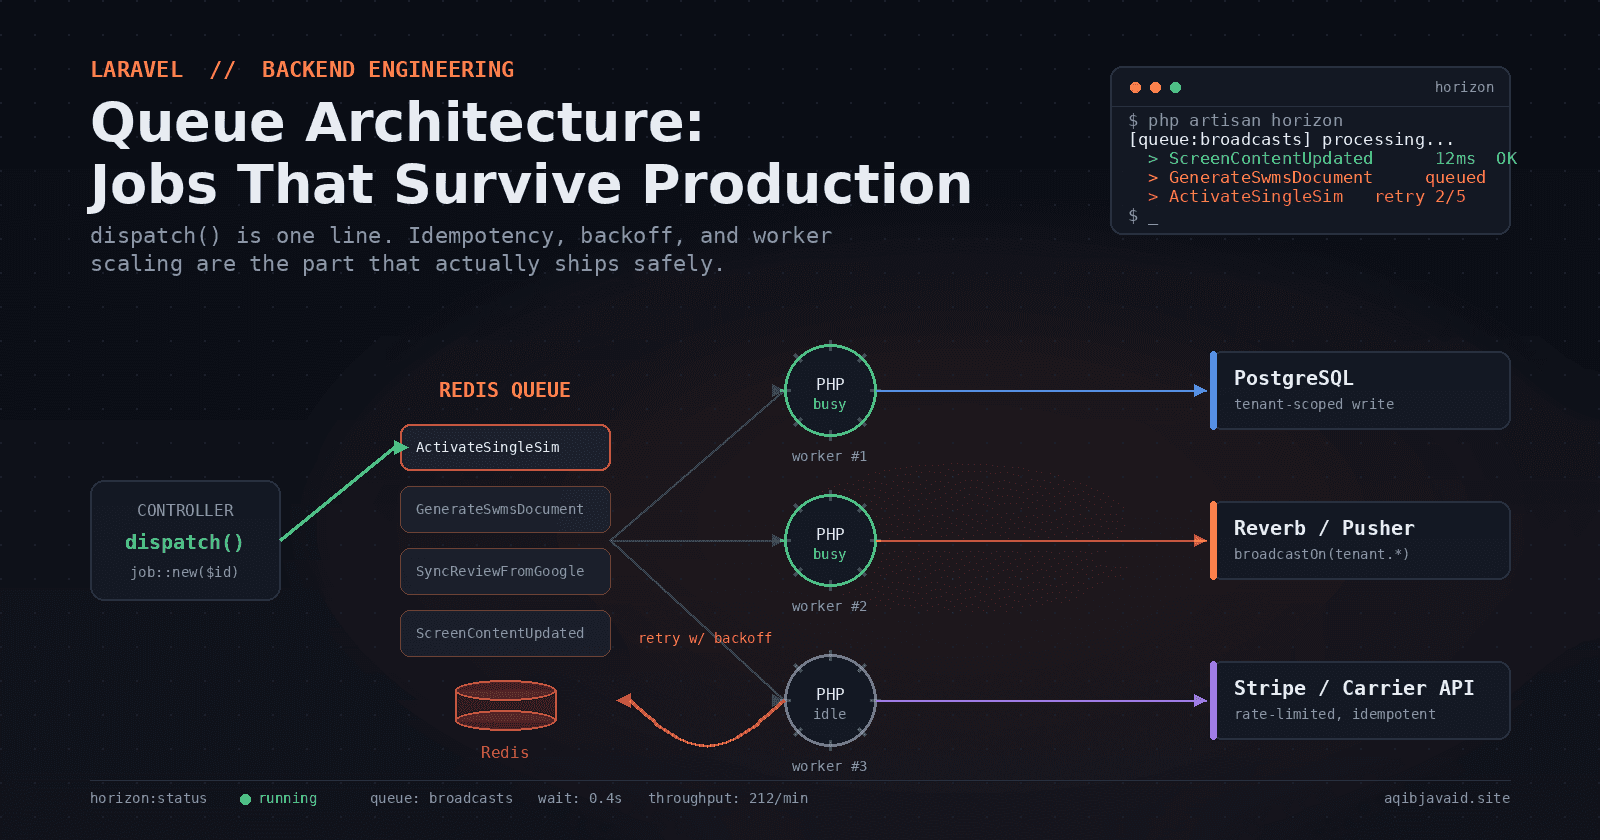
Laravel Queue Architecture: Jobs That Survive Production
dispatch() is one line. Making that job safe to retry, cheap to scale, and impossible to double-run is the actual engineering problem.
Have a complex technical project in mind?
Available for full-stack engineering, performance audits, cloud deployments, and high-concurrency systems architecture.